> ## Documentation Index
> Fetch the complete documentation index at: https://support.entegrata.com/llms.txt
> Use this file to discover all available pages before exploring further.
# View & Filter Jobs
> Search and filter jobs by time, status, and resource
## Overview
Use filters to find specific jobs, analyze patterns, and troubleshoot issues efficiently.
## Viewing Collection Jobs
Jobs can be viewed at two levels:
### Connection-Level Jobs
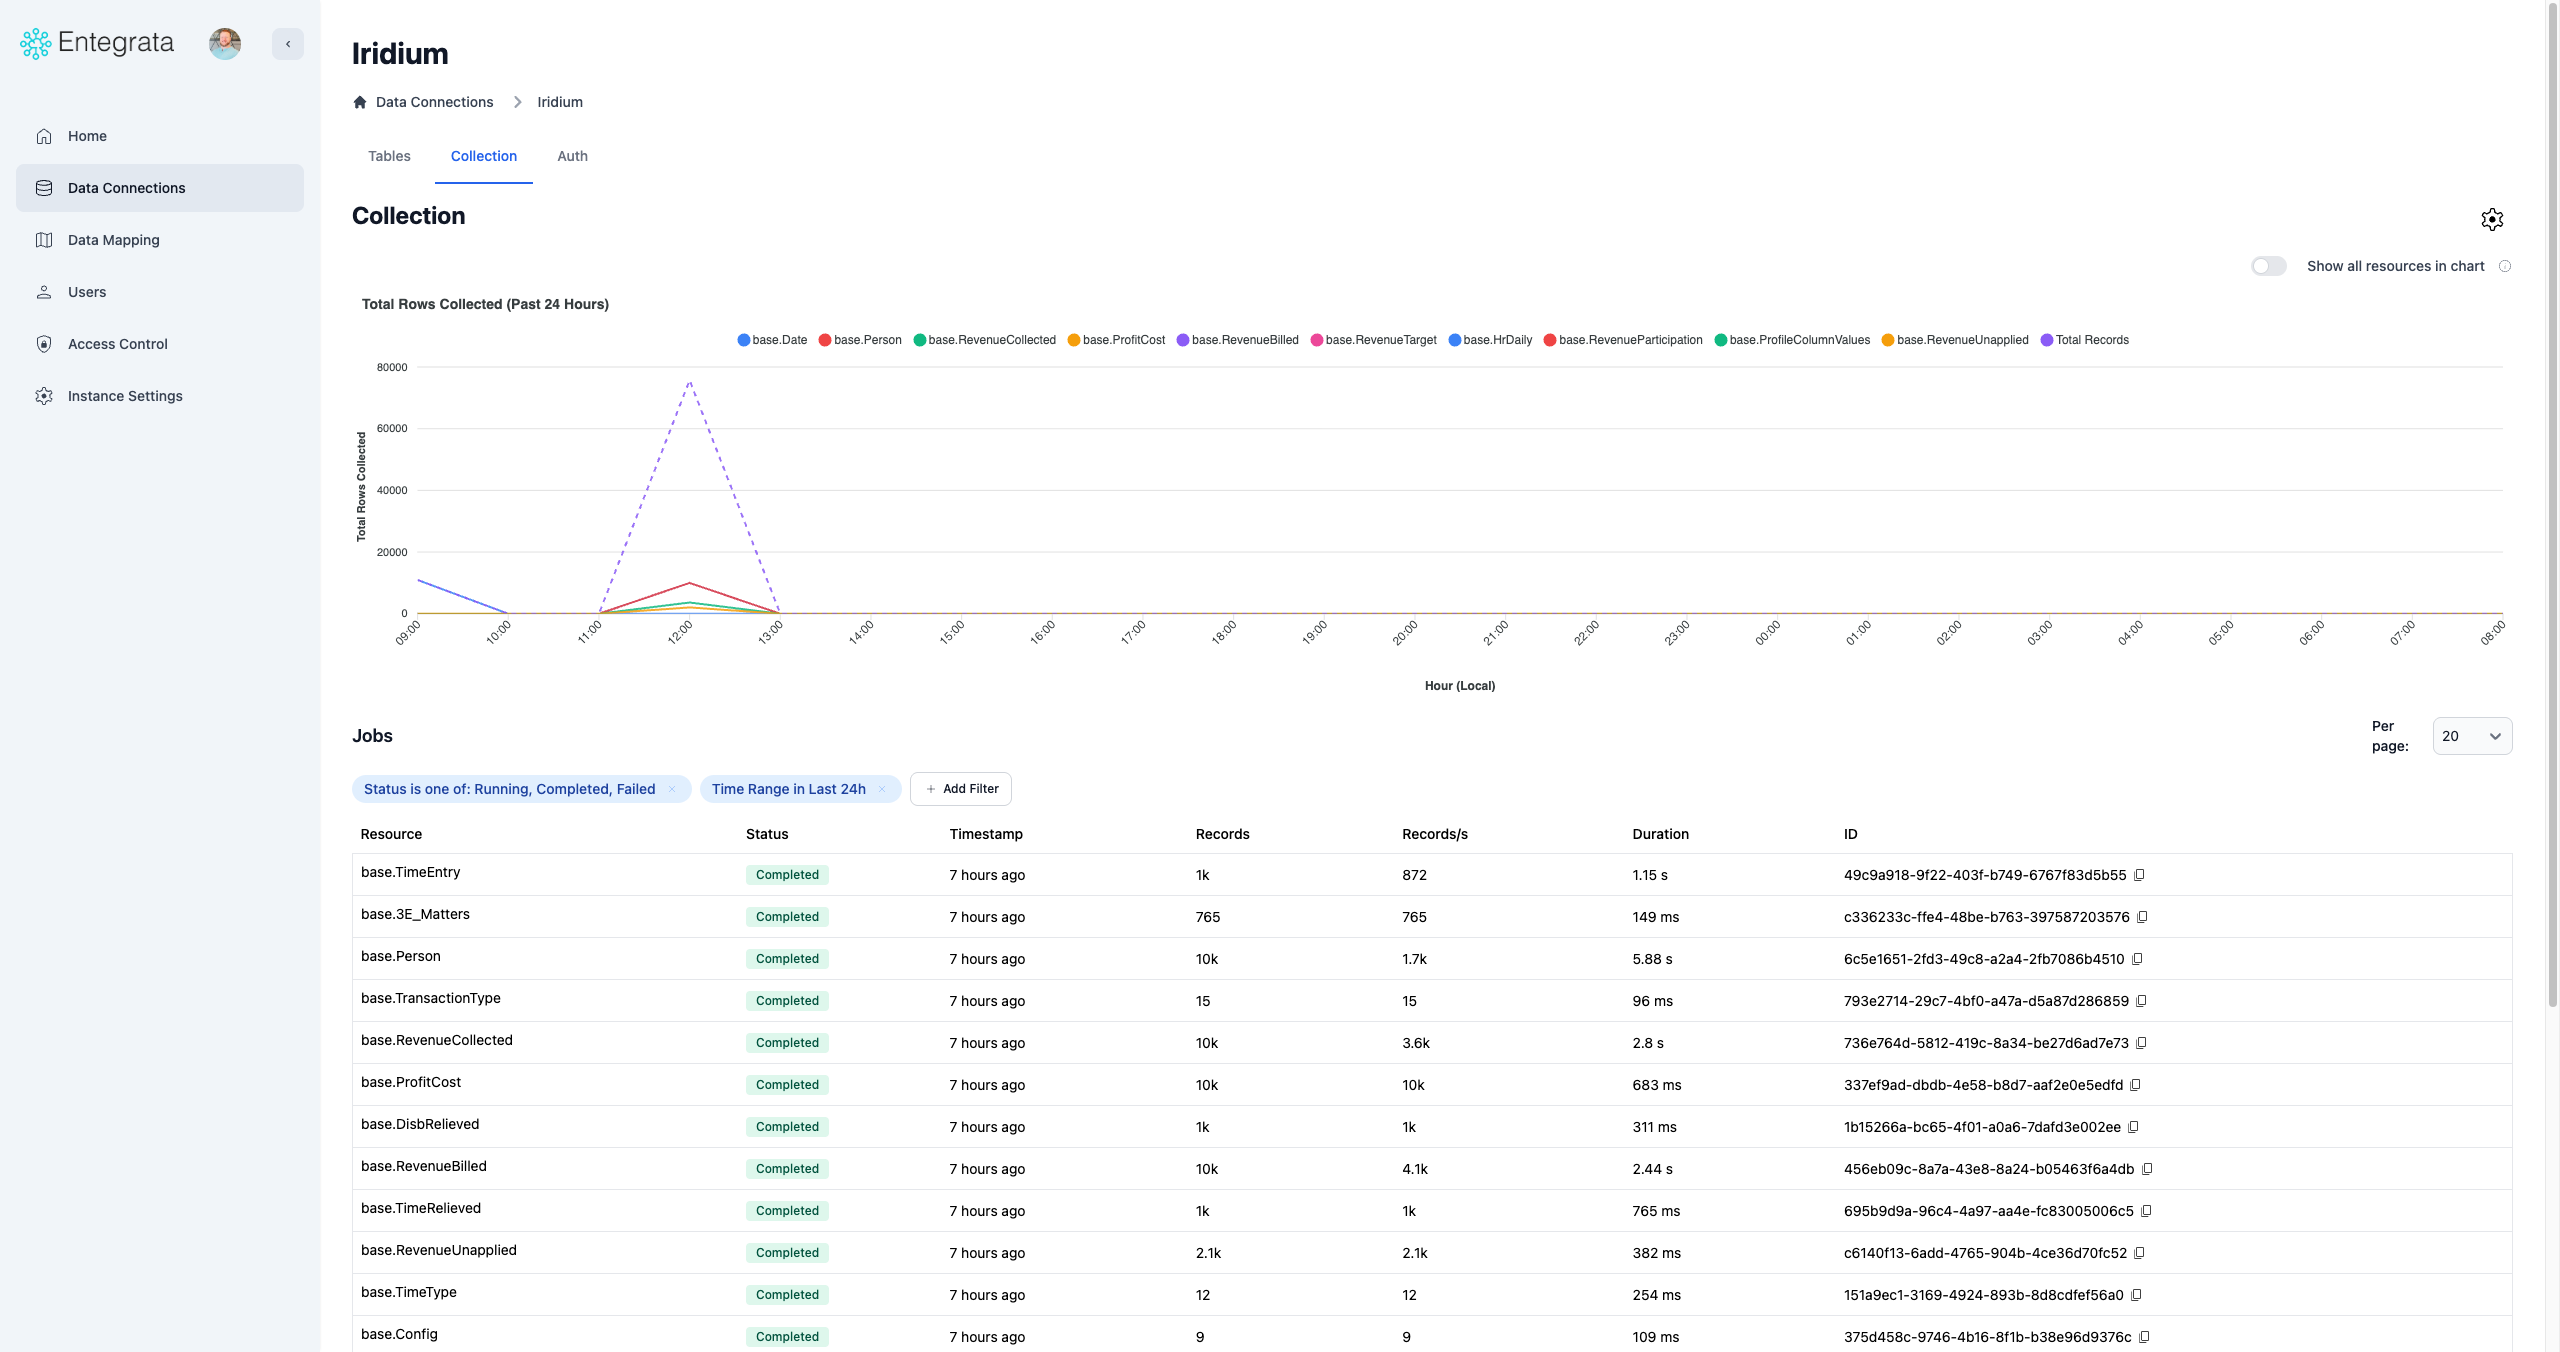
View all collection jobs across all resources in a connection.
Click on a connection from the Connections page
Click the **Collection** or **Jobs** tab
 ### Resource-Level Jobs
View collection jobs for a specific resource.
Click on a resource name from the Resources page
Click the **Collection** tab to see jobs for this resource only
## Job Information
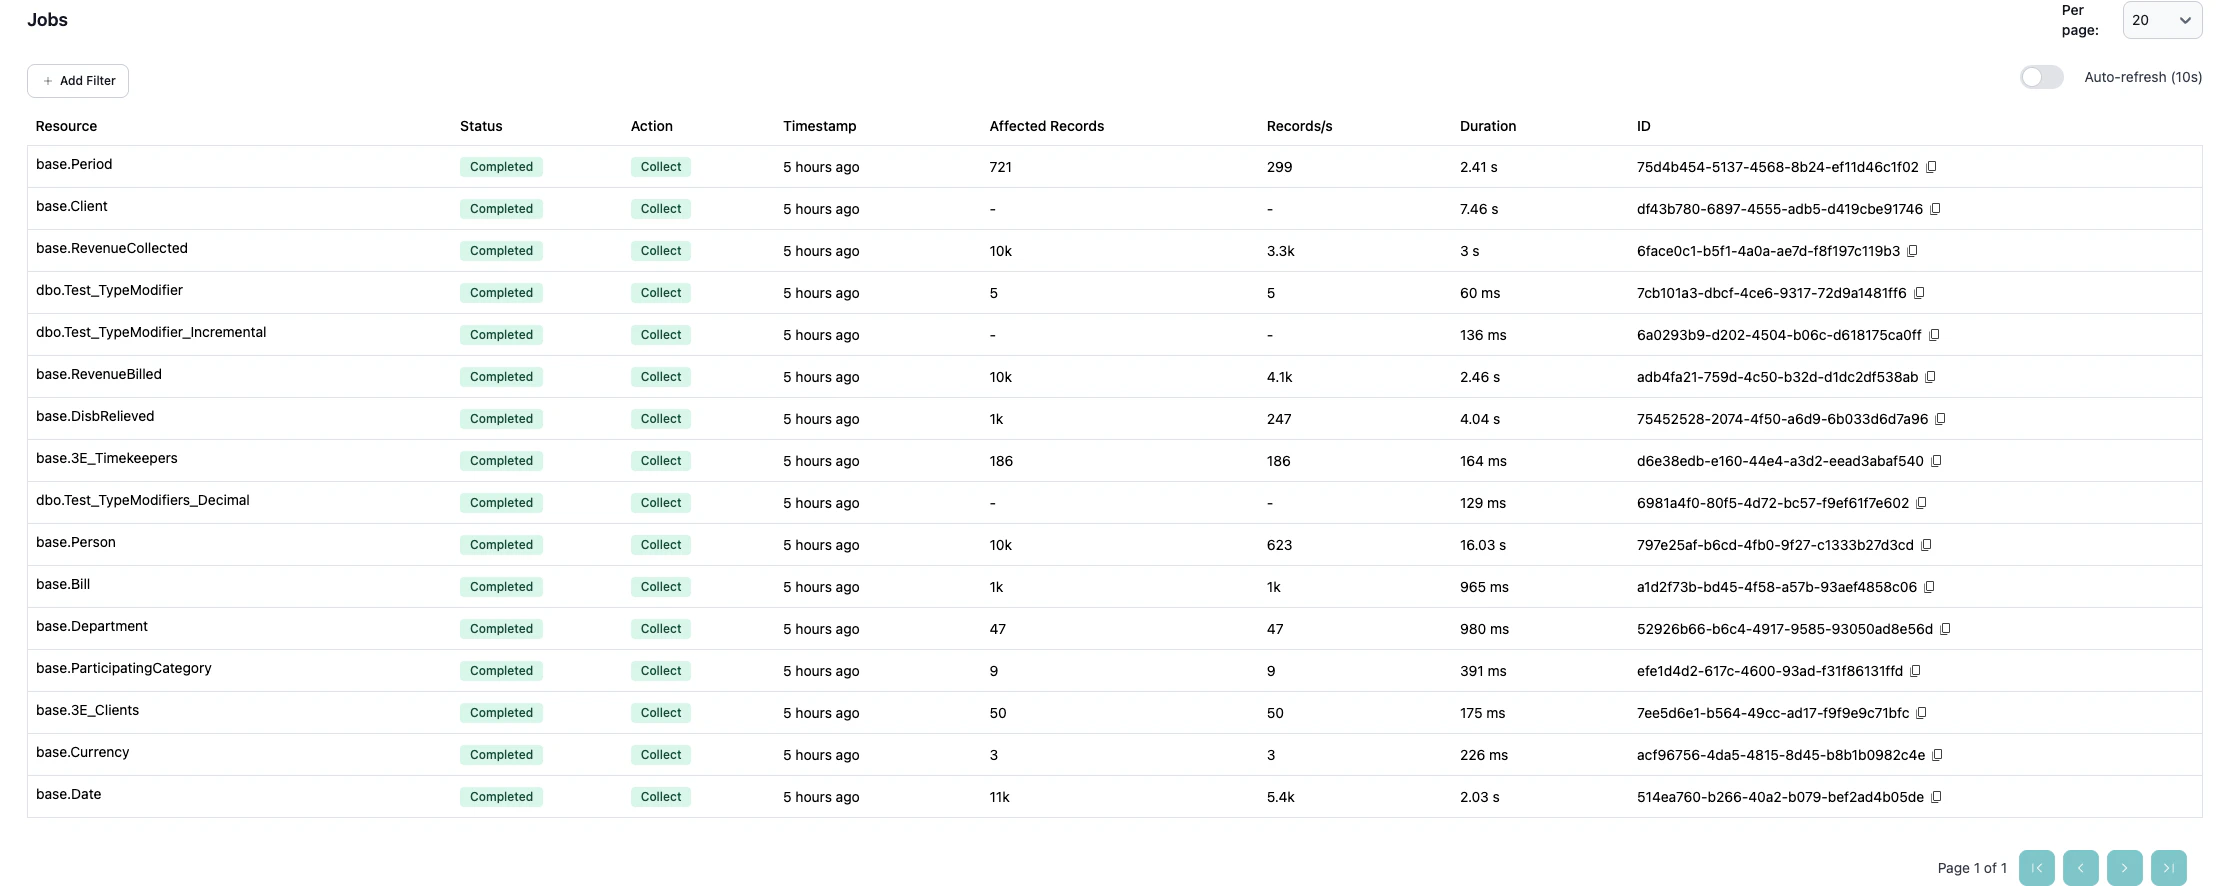
Each job displays key information:
### Job Status
Jobs have one of the following statuses:
* **Running** (Blue) - Collection is currently in progress
* **Completed** (Green) - Collection finished successfully
* **Failed** (Red) - Collection encountered an error and stopped
* **Scheduled** (Gray) - Job is queued but hasn't started yet
### Resource-Level Jobs
View collection jobs for a specific resource.
Click on a resource name from the Resources page
Click the **Collection** tab to see jobs for this resource only
## Job Information
Each job displays key information:
### Job Status
Jobs have one of the following statuses:
* **Running** (Blue) - Collection is currently in progress
* **Completed** (Green) - Collection finished successfully
* **Failed** (Red) - Collection encountered an error and stopped
* **Scheduled** (Gray) - Job is queued but hasn't started yet
 ### Job Metrics
For each job, you can see:
* **Resource** (connection-level view only) - Which resource was collected
* **Timestamp** - When the job started
* **Records** - Total number of records collected
* **Records/s** - Collection speed (records per second)
* **Duration** - How long the collection took
* **Job ID** - Unique identifier for troubleshooting
### Job Metrics
For each job, you can see:
* **Resource** (connection-level view only) - Which resource was collected
* **Timestamp** - When the job started
* **Records** - Total number of records collected
* **Records/s** - Collection speed (records per second)
* **Duration** - How long the collection took
* **Job ID** - Unique identifier for troubleshooting
 ## Collection Performance Chart
The Collection page includes a visual chart showing collection trends over time.
## Collection Performance Chart
The Collection page includes a visual chart showing collection trends over time.
 ### Chart Features
* **Time series view** - See collection volume and frequency over time
* **Multiple resources** - Compare performance across resources (connection-level view)
* **Zoom and pan** - Focus on specific time periods
* **Hover details** - See exact values for any data point
### Interpreting the Chart
The chart helps you:
* **Identify trends** - Is data volume growing or shrinking?
* **Spot anomalies** - Sudden spikes or drops in record counts
* **Verify schedules** - Are collections running when expected?
* **Compare resources** - Which resources collect the most data?
Use the chart to validate that collections are running according to your schedule and processing expected data volumes.
## Filtering and Searching Jobs
Refine the jobs list to find specific executions.
### Time Range Filters
Filter jobs by when they ran:
Click the filter button or use the filter controls above the jobs table
### Chart Features
* **Time series view** - See collection volume and frequency over time
* **Multiple resources** - Compare performance across resources (connection-level view)
* **Zoom and pan** - Focus on specific time periods
* **Hover details** - See exact values for any data point
### Interpreting the Chart
The chart helps you:
* **Identify trends** - Is data volume growing or shrinking?
* **Spot anomalies** - Sudden spikes or drops in record counts
* **Verify schedules** - Are collections running when expected?
* **Compare resources** - Which resources collect the most data?
Use the chart to validate that collections are running according to your schedule and processing expected data volumes.
## Filtering and Searching Jobs
Refine the jobs list to find specific executions.
### Time Range Filters
Filter jobs by when they ran:
Click the filter button or use the filter controls above the jobs table
 Choose from preset ranges or specify custom dates:
* Last 24 hours (default)
* Last 7 days
* Last 30 days
* Custom date range
The jobs table and chart update to show only jobs within the selected range
### Status Filters
Filter jobs by their execution status:
Choose from preset ranges or specify custom dates:
* Last 24 hours (default)
* Last 7 days
* Last 30 days
* Custom date range
The jobs table and chart update to show only jobs within the selected range
### Status Filters
Filter jobs by their execution status:
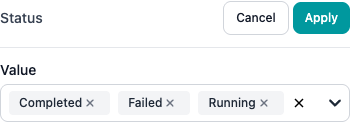 * Show/hide Running jobs
* Show/hide Completed jobs
* Show/hide Failed jobs
* Show/hide Scheduled jobs
To troubleshoot issues, filter to show only Failed jobs.
### Resource Filters (Connection-Level Only)
When viewing connection-level jobs, filter by specific resources:
Select one or more resources to see only their jobs.
### Combining Filters
All filters work together. For example:
* **Last 7 days** + **Failed status** + **Specific resource** = See all failures for that resource in the past week
### Chart vs. Table Filters
By default, the chart shows up to 1000 recent jobs for visualization, while the table is paginated. Both respect your filter settings.
**Toggle Chart Resources**
For connections with many resources, you can limit the chart to show:
* **Top 10 resources** (default) - Most active resources by record count
* **All resources** - Toggle on to see every resource
* Show/hide Running jobs
* Show/hide Completed jobs
* Show/hide Failed jobs
* Show/hide Scheduled jobs
To troubleshoot issues, filter to show only Failed jobs.
### Resource Filters (Connection-Level Only)
When viewing connection-level jobs, filter by specific resources:
Select one or more resources to see only their jobs.
### Combining Filters
All filters work together. For example:
* **Last 7 days** + **Failed status** + **Specific resource** = See all failures for that resource in the past week
### Chart vs. Table Filters
By default, the chart shows up to 1000 recent jobs for visualization, while the table is paginated. Both respect your filter settings.
**Toggle Chart Resources**
For connections with many resources, you can limit the chart to show:
* **Top 10 resources** (default) - Most active resources by record count
* **All resources** - Toggle on to see every resource
 ## Job Pagination
Jobs are displayed in pages for easy navigation.
Choose how many jobs to show per page (10, 20, 50, or 100)
## Job Pagination
Jobs are displayed in pages for easy navigation.
Choose how many jobs to show per page (10, 20, 50, or 100)
 Use the pagination controls at the bottom of the table to move between pages
 ## Job Performance Metrics
### Records Collected
Total number of records processed in the job. Use this to:
* Verify expected data volume
* Track data growth over time
* Identify anomalies (sudden spikes or drops)
### Records Per Second
Processing speed showing how fast data was collected. Use this to:
* Benchmark normal performance
* Identify slow collections
* Compare performance across resources
### Duration
Total time from job start to completion. Use this to:
* Estimate future collection times
* Schedule jobs to avoid conflicts
* Identify performance degradation
## Best Practices for Monitoring Jobs
Configure notifications for job failures to respond quickly to issues
Check failed jobs regularly and resolve issues promptly
Track job duration and record counts over time to spot degradation
Unusual record counts or durations may indicate data quality issues
Manually trigger a collection after changing settings to verify it works
Focus on recent jobs when troubleshooting active issues
## Next Steps
Understand collection jobs and performance monitoring
Understand job statuses and what they mean
Troubleshooting collection jobs
## Job Performance Metrics
### Records Collected
Total number of records processed in the job. Use this to:
* Verify expected data volume
* Track data growth over time
* Identify anomalies (sudden spikes or drops)
### Records Per Second
Processing speed showing how fast data was collected. Use this to:
* Benchmark normal performance
* Identify slow collections
* Compare performance across resources
### Duration
Total time from job start to completion. Use this to:
* Estimate future collection times
* Schedule jobs to avoid conflicts
* Identify performance degradation
## Best Practices for Monitoring Jobs
Configure notifications for job failures to respond quickly to issues
Check failed jobs regularly and resolve issues promptly
Track job duration and record counts over time to spot degradation
Unusual record counts or durations may indicate data quality issues
Manually trigger a collection after changing settings to verify it works
Focus on recent jobs when troubleshooting active issues
## Next Steps
Understand collection jobs and performance monitoring
Understand job statuses and what they mean
Troubleshooting collection jobs