> ## Documentation Index
> Fetch the complete documentation index at: https://support.entegrata.com/llms.txt
> Use this file to discover all available pages before exploring further.
# Running Pipelines
> How to execute and monitor pipeline jobs in Entegrata
## Overview
Running a pipeline executes all configured data type mappings, pulling data from your Collector sources and loading it into your Entegrata data warehouse. Pipelines can run manually on-demand or automatically based on configured triggers.
## Execution Modes
Entegrata supports two pipeline execution modes:
### Standard Run
A standard run executes the pipeline and writes data to your production data warehouse. Use this for:
* Production data processing
* Scheduled automatic executions
* Final data loads after validation
### Dry Run
A dry run executes the pipeline logic without writing data to the warehouse. Use this for:
* Testing new pipelines before deployment
* Validating field mappings
* Troubleshooting errors
* Verifying source data quality
Always perform a dry run before deploying a new pipeline or after making significant mapping changes. This helps catch errors without impacting production data.
## Running a Pipeline Manually
Log in to the [Entegrata Admin Portal](https://admin.entegrata.com) and go to the **Pipelines** tab.
Find the pipeline you want to run using the search bar or by browsing the list.
 Before running, verify the pipeline status:
* **Draft**: Pipeline must be deployed before running
* **Deployed**: Ready to run
* **Running**: Already executing (wait for completion)
* **Paused**: Can be run manually even when paused
If the pipeline is already running, you cannot start another execution. Wait for the current run to complete.
Click the three-dot menu (⋮) in the Actions column for the pipeline.
Before running, verify the pipeline status:
* **Draft**: Pipeline must be deployed before running
* **Deployed**: Ready to run
* **Running**: Already executing (wait for completion)
* **Paused**: Can be run manually even when paused
If the pipeline is already running, you cannot start another execution. Wait for the current run to complete.
Click the three-dot menu (⋮) in the Actions column for the pipeline.
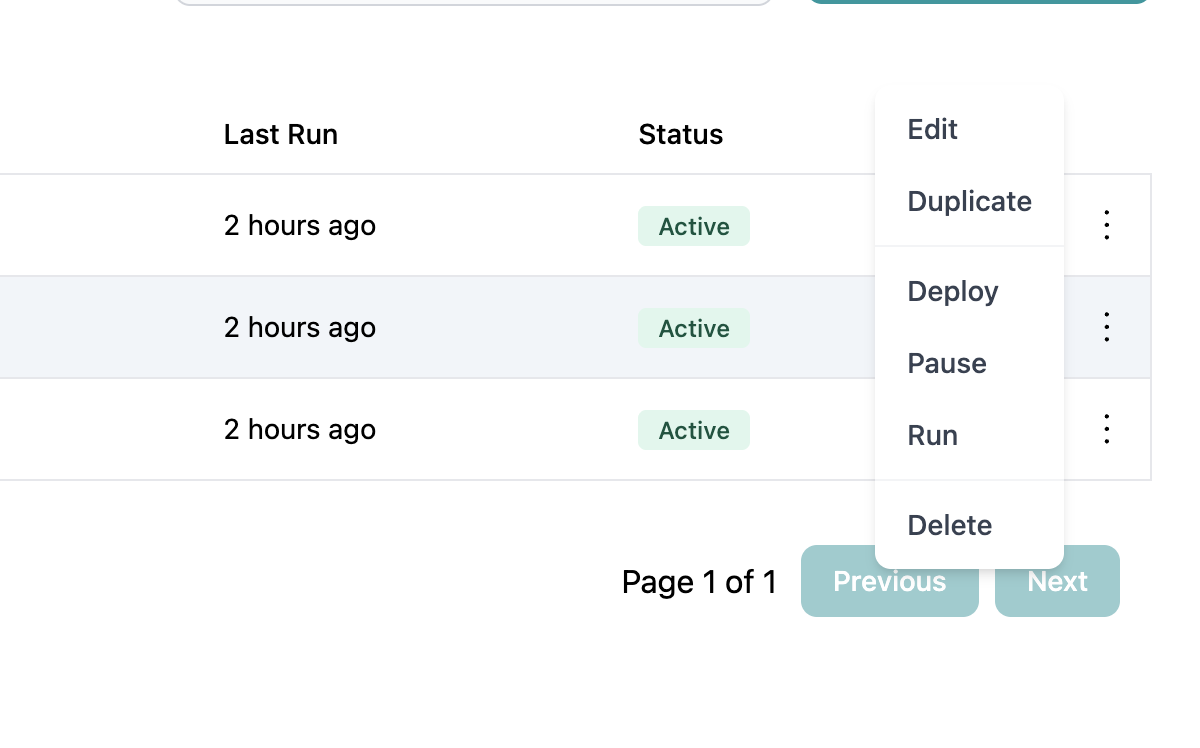 From the actions menu, choose:
* **Run** - Execute with data writes (production run)
* **Dry Run** - Execute without data writes (test run)
From the actions menu, choose:
* **Run** - Execute with data writes (production run)
* **Dry Run** - Execute without data writes (test run)
 After selecting Run or Dry Run, the pipeline execution begins immediately. You'll see:
* Success message confirming the job was queued
* Pipeline status changes to **Running**
* Execution start time is recorded
While the pipeline runs, monitor its progress:
* Status badge shows "Running" with progress indicator
* Click the pipeline name to view detailed logs
* Refresh the page to see updated status
After selecting Run or Dry Run, the pipeline execution begins immediately. You'll see:
* Success message confirming the job was queued
* Pipeline status changes to **Running**
* Execution start time is recorded
While the pipeline runs, monitor its progress:
* Status badge shows "Running" with progress indicator
* Click the pipeline name to view detailed logs
* Refresh the page to see updated status
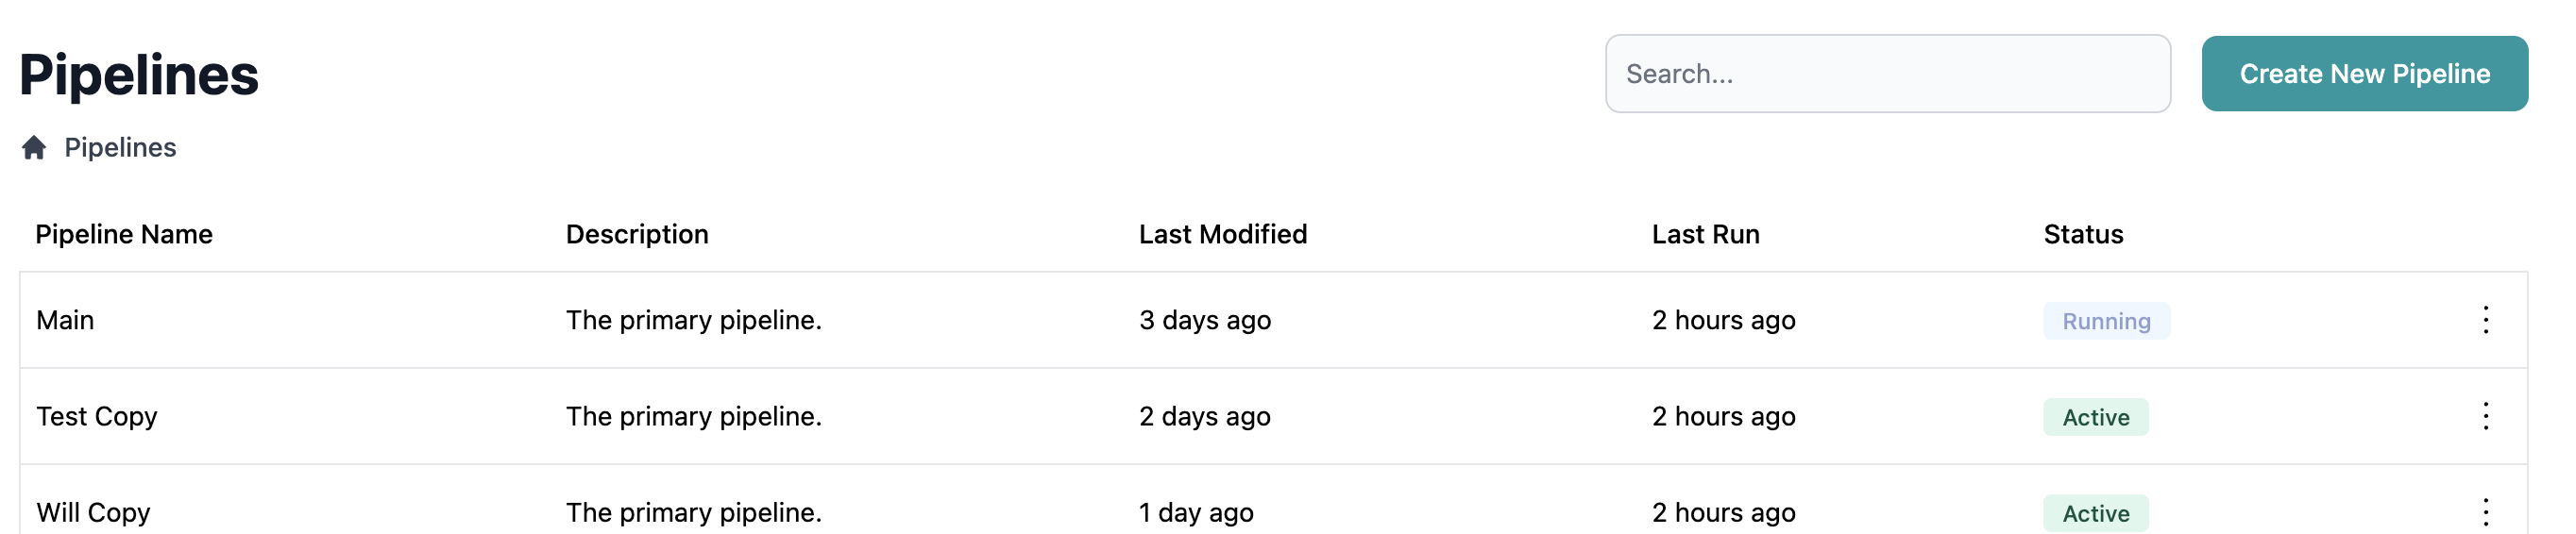 Once execution completes, the status updates to:
* **Success** (green badge) - Completed without errors
* **Failed** (red badge) - Encountered errors
The "Last Run" column shows the execution timestamp.
## Scheduled Execution
Pipelines with scheduled triggers run automatically without manual intervention.
### Configuring Schedules
When creating or editing a pipeline, select **Scheduled** as the trigger type and provide a cron expression:
**Common Schedules:**
* `0 0 * * *` - Daily at midnight
* `0 2 * * *` - Daily at 2 AM
* `0 */6 * * *` - Every 6 hours
* `0 9 * * 1-5` - Weekdays at 9 AM
* `0 0 1 * *` - First day of each month at midnight
Scheduled pipelines must be in **Active** status to run automatically. Paused or Draft pipelines won't execute on schedule.
### Managing Scheduled Pipelines
To control scheduled execution:
* **Pause** - Temporarily disable automatic runs (pipeline remains deployed)
* **Activate** - Re-enable automatic runs
* **Edit Schedule** - Modify the cron expression through trigger settings
Learn how to pause and activate pipelines
## Event-Driven Execution
Event-driven pipelines run automatically when specific events occur, such as:
* New data detected in source systems
* External API calls or webhooks
* Completion of upstream pipelines
* Manual triggers from external systems
Event-driven execution requires additional configuration with your Collector and may not be available for all data sources. Contact your administrator for setup assistance.
## Execution Monitoring
### Understanding Status Indicators
Pipeline completed without errors. All data types processed successfully.
Pipeline is currently executing. Check back for completion status.
Pipeline encountered errors during execution. Review logs for details.
Pipeline is queued for execution but hasn't started yet.
### Execution Metrics
Key metrics to monitor:
**Execution Time**
* How long the pipeline took to complete
* Helps identify performance issues or bottlenecks
**Row Counts**
* Rows read from each source
* Rows written to each data type
* Helps validate data volumes
**Success Rate**
* Percentage of successful vs. failed runs
* Indicator of pipeline stability
**Last Run Time**
* When the pipeline last executed
* Helps verify schedules are working
## Force Run vs. Incremental Run
### Force Run (Full Refresh)
Processes all data from sources, regardless of when it was last processed. Use for:
* Initial pipeline deployment
* After structural changes to mappings
* Recovery from errors
* Data quality fixes
Full refresh runs can be time-consuming and resource-intensive for large datasets. Use sparingly in production.
### Incremental Run (Default)
Processes only new or changed data since the last successful run. Use for:
* Regular scheduled executions
* Efficient ongoing data synchronization
* Minimizing processing time and costs
Incremental processing requires proper configuration of change tracking or timestamp fields in your source data.
## Troubleshooting Pipeline Runs
### Pipeline Won't Start
**Problem:** Clicking Run doesn't start execution.
**Solutions:**
* Verify pipeline is deployed (not in Draft status)
* Check if pipeline is already running
* Ensure you have run permissions
* Verify Collector sources are connected and accessible
### Pipeline Fails Immediately
**Problem:** Pipeline status changes to Failed within seconds.
**Solutions:**
* Review error logs for specific error messages
* Verify source connections are active
* Check for missing required field mappings
* Ensure data types have valid configurations
* Run in dry-run mode to isolate issues
### Pipeline Runs Too Long
**Problem:** Pipeline takes much longer than expected.
**Solutions:**
* Check source data volumes (unexpected growth?)
* Review field mappings for inefficient transformations
* Verify source queries don't have missing filters
* Consider breaking into smaller pipelines
* Check for network or database performance issues
### Pipeline Succeeds But Data Is Wrong
**Problem:** Pipeline completes successfully but data doesn't look right.
**Solutions:**
* Run in dry-run mode and examine query logic
* Verify field mappings are pointing to correct source fields
* Check transformation logic (COALESCE, CONCAT, CASE)
* Review default values for unexpected overrides
* Validate source data quality
### Dry Run Succeeds, Standard Run Fails
**Problem:** Dry run works but standard run encounters errors.
**Solutions:**
* Check warehouse permissions and write access
* Verify storage quotas haven't been exceeded
* Review data type constraints in warehouse schema
* Check for concurrent processes causing locks
* Examine differences in dry-run vs. standard execution paths
## Best Practices
**Test with Dry Run First**
Always perform a dry run before:
* Deploying a new pipeline
* Making significant mapping changes
* Processing in a new environment
* Recovery after errors
Dry runs catch issues without impacting production data.
**Monitor First Runs Closely**
When running a pipeline for the first time:
* Watch execution logs in real-time
* Verify row counts match expectations
* Check data quality in the warehouse
* Be prepared to pause or stop if issues arise
**Schedule During Low-Usage Hours**
For scheduled pipelines:
* Run during off-peak hours (early morning, weekends)
* Avoid business-critical hours
* Consider time zones if processing global data
* Allow buffer time before business day starts
**Set Up Alerts**
Configure monitoring alerts for:
* Failed pipeline executions
* Pipelines running longer than expected
* Zero rows processed (may indicate source issues)
* Repeated failures over multiple runs
**Document Execution Patterns**
Keep notes about:
* Typical execution times
* Expected row counts
* Known seasonal variations
* Dependencies on other systems
This helps identify anomalies quickly.
## Execution Frequency Guidelines
### Daily Pipelines
Best for data that changes frequently and needs to be current:
* Client and account information
* Transaction data
* Daily metrics and KPIs
### Weekly Pipelines
Best for less time-sensitive data or data-intensive processes:
* Historical aggregations
* Complex analytical calculations
* Archive and cleanup operations
### Monthly Pipelines
Best for periodic reporting data:
* Month-end calculations
* Historical trend analysis
* Regulatory reporting data
### On-Demand Pipelines
Best for ad-hoc or conditional processing:
* Data migrations
* Backfill operations
* Testing and development
* Manual data corrections
## Related Topics
Learn how to deploy pipelines before running
Control pipeline active/paused status
Set up pipelines with proper triggers
Configure mappings that pipelines execute
Once execution completes, the status updates to:
* **Success** (green badge) - Completed without errors
* **Failed** (red badge) - Encountered errors
The "Last Run" column shows the execution timestamp.
## Scheduled Execution
Pipelines with scheduled triggers run automatically without manual intervention.
### Configuring Schedules
When creating or editing a pipeline, select **Scheduled** as the trigger type and provide a cron expression:
**Common Schedules:**
* `0 0 * * *` - Daily at midnight
* `0 2 * * *` - Daily at 2 AM
* `0 */6 * * *` - Every 6 hours
* `0 9 * * 1-5` - Weekdays at 9 AM
* `0 0 1 * *` - First day of each month at midnight
Scheduled pipelines must be in **Active** status to run automatically. Paused or Draft pipelines won't execute on schedule.
### Managing Scheduled Pipelines
To control scheduled execution:
* **Pause** - Temporarily disable automatic runs (pipeline remains deployed)
* **Activate** - Re-enable automatic runs
* **Edit Schedule** - Modify the cron expression through trigger settings
Learn how to pause and activate pipelines
## Event-Driven Execution
Event-driven pipelines run automatically when specific events occur, such as:
* New data detected in source systems
* External API calls or webhooks
* Completion of upstream pipelines
* Manual triggers from external systems
Event-driven execution requires additional configuration with your Collector and may not be available for all data sources. Contact your administrator for setup assistance.
## Execution Monitoring
### Understanding Status Indicators
Pipeline completed without errors. All data types processed successfully.
Pipeline is currently executing. Check back for completion status.
Pipeline encountered errors during execution. Review logs for details.
Pipeline is queued for execution but hasn't started yet.
### Execution Metrics
Key metrics to monitor:
**Execution Time**
* How long the pipeline took to complete
* Helps identify performance issues or bottlenecks
**Row Counts**
* Rows read from each source
* Rows written to each data type
* Helps validate data volumes
**Success Rate**
* Percentage of successful vs. failed runs
* Indicator of pipeline stability
**Last Run Time**
* When the pipeline last executed
* Helps verify schedules are working
## Force Run vs. Incremental Run
### Force Run (Full Refresh)
Processes all data from sources, regardless of when it was last processed. Use for:
* Initial pipeline deployment
* After structural changes to mappings
* Recovery from errors
* Data quality fixes
Full refresh runs can be time-consuming and resource-intensive for large datasets. Use sparingly in production.
### Incremental Run (Default)
Processes only new or changed data since the last successful run. Use for:
* Regular scheduled executions
* Efficient ongoing data synchronization
* Minimizing processing time and costs
Incremental processing requires proper configuration of change tracking or timestamp fields in your source data.
## Troubleshooting Pipeline Runs
### Pipeline Won't Start
**Problem:** Clicking Run doesn't start execution.
**Solutions:**
* Verify pipeline is deployed (not in Draft status)
* Check if pipeline is already running
* Ensure you have run permissions
* Verify Collector sources are connected and accessible
### Pipeline Fails Immediately
**Problem:** Pipeline status changes to Failed within seconds.
**Solutions:**
* Review error logs for specific error messages
* Verify source connections are active
* Check for missing required field mappings
* Ensure data types have valid configurations
* Run in dry-run mode to isolate issues
### Pipeline Runs Too Long
**Problem:** Pipeline takes much longer than expected.
**Solutions:**
* Check source data volumes (unexpected growth?)
* Review field mappings for inefficient transformations
* Verify source queries don't have missing filters
* Consider breaking into smaller pipelines
* Check for network or database performance issues
### Pipeline Succeeds But Data Is Wrong
**Problem:** Pipeline completes successfully but data doesn't look right.
**Solutions:**
* Run in dry-run mode and examine query logic
* Verify field mappings are pointing to correct source fields
* Check transformation logic (COALESCE, CONCAT, CASE)
* Review default values for unexpected overrides
* Validate source data quality
### Dry Run Succeeds, Standard Run Fails
**Problem:** Dry run works but standard run encounters errors.
**Solutions:**
* Check warehouse permissions and write access
* Verify storage quotas haven't been exceeded
* Review data type constraints in warehouse schema
* Check for concurrent processes causing locks
* Examine differences in dry-run vs. standard execution paths
## Best Practices
**Test with Dry Run First**
Always perform a dry run before:
* Deploying a new pipeline
* Making significant mapping changes
* Processing in a new environment
* Recovery after errors
Dry runs catch issues without impacting production data.
**Monitor First Runs Closely**
When running a pipeline for the first time:
* Watch execution logs in real-time
* Verify row counts match expectations
* Check data quality in the warehouse
* Be prepared to pause or stop if issues arise
**Schedule During Low-Usage Hours**
For scheduled pipelines:
* Run during off-peak hours (early morning, weekends)
* Avoid business-critical hours
* Consider time zones if processing global data
* Allow buffer time before business day starts
**Set Up Alerts**
Configure monitoring alerts for:
* Failed pipeline executions
* Pipelines running longer than expected
* Zero rows processed (may indicate source issues)
* Repeated failures over multiple runs
**Document Execution Patterns**
Keep notes about:
* Typical execution times
* Expected row counts
* Known seasonal variations
* Dependencies on other systems
This helps identify anomalies quickly.
## Execution Frequency Guidelines
### Daily Pipelines
Best for data that changes frequently and needs to be current:
* Client and account information
* Transaction data
* Daily metrics and KPIs
### Weekly Pipelines
Best for less time-sensitive data or data-intensive processes:
* Historical aggregations
* Complex analytical calculations
* Archive and cleanup operations
### Monthly Pipelines
Best for periodic reporting data:
* Month-end calculations
* Historical trend analysis
* Regulatory reporting data
### On-Demand Pipelines
Best for ad-hoc or conditional processing:
* Data migrations
* Backfill operations
* Testing and development
* Manual data corrections
## Related Topics
Learn how to deploy pipelines before running
Control pipeline active/paused status
Set up pipelines with proper triggers
Configure mappings that pipelines execute