> ## Documentation Index
> Fetch the complete documentation index at: https://support.entegrata.com/llms.txt
> Use this file to discover all available pages before exploring further.
# Build Custom Reports
> Three ways to build your own Power BI reports on the data Entegrata delivers to your Databricks environment
## Overview
You can build your own Power BI reports on the data Entegrata delivers to your Databricks environment. This page covers three ways to do it and which one to choose.
## Prerequisites
* **Power BI Desktop.** [Download Power BI Desktop](https://www.microsoft.com/en-us/download/details.aspx?id=58494) if you do not have it.
* **Build permission.** For option 1 you need **Build** permission on the semantic model. Ask the semantic model's owner or a workspace admin if you are not sure.
* **License.** To publish and share reports, you need a Power BI Pro or Premium Per User license. Who can view them depends on your workspace; see [Licensing Patterns](/power-bi/licensing).
* **Connection details.** For options 2 and 3 you need your Databricks connection details. Ask your Entegrata Customer Experience Manager for them. See [Set up your connection](#set-up-your-connection).
## Choose an Option
| Option | Use it when | Trade-off |
| - | - | - |
| 1. Connect to an existing model | Your firm, or Entegrata, has already published a semantic model with the data you need. | Recommended. You start from a trusted model and can begin building straight away. |
| 2. Connect to a Databricks view | You need a new model, for example one you plan to share with others. | Next best. You still build on curated, governed views. |
| 3. Run a Databricks query | You are prototyping, and no view gives you what you need. | Most flexible, and the biggest risk to governance and stability. Use it only when options 1 and 2 cannot work. |
For Microsoft's general guide to the Databricks connection, see [Connect Power BI Desktop to Azure Databricks](https://learn.microsoft.com/azure/databricks/partners/bi/power-bi/desktop).
## Option 1: Connect to an Existing Model
You can build on a published semantic model in the Power BI service or in Power BI Desktop. Either way, the report uses a live connection to the model, so the model itself does not change.
* **In the Power BI service:** create a new report from your workspace, pick the published semantic model, and select **Create a blank report**. Entegrata recommends this over **Auto-create report**. See [Microsoft Learn: Create reports based on semantic models from different workspaces](https://learn.microsoft.com/power-bi/connect-data/service-datasets-discover-across-workspaces).
* **In Power BI Desktop:** select **Get data**, then **Power BI semantic models**, and connect to the model. See [Microsoft Learn: Connect to semantic models in the Power BI service from Power BI Desktop](https://learn.microsoft.com/power-bi/connect-data/desktop-report-lifecycle-datasets).
## Option 2: Connect to a Databricks View
This option uses a shared query called **Common Schema**. It holds your connection details in one place, so every table you add uses the same connection.
In Power BI Desktop, start a blank report and open **Transform data**.
Create the four connection parameters described in [Set up your connection](#set-up-your-connection).
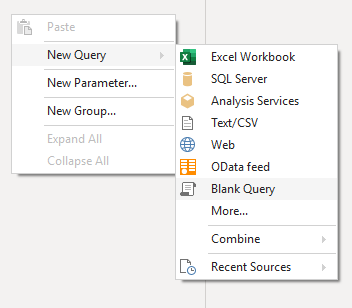
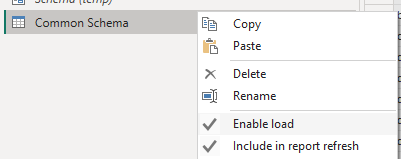
Right-click in the Queries pane and select **New Query**, then **Blank Query**. Name it `Common Schema`, open the **Advanced Editor**, paste in the code below, and select **Done**. Then right-click the query and turn off **Enable load**.
 ```powerquery theme={null}
let
Source =
Databricks.Catalogs(
DatabricksHost
, DatabricksHTTPPath
, [
Catalog = "" // Does not force a specific catalog
, Database = "" // Does not force a specific database
, EnableQueryResultDownload = "0"
, Implementation = "2.0"
]
)
, ref_database =
Source{[
Name = Catalog
, Kind = "Database"
]}[Data]
, ref_schema =
ref_database{[
Name = Schema
, Kind = "Schema"
]}[Data]
in
ref_schema
```
```powerquery theme={null}
let
Source =
Databricks.Catalogs(
DatabricksHost
, DatabricksHTTPPath
, [
Catalog = "" // Does not force a specific catalog
, Database = "" // Does not force a specific database
, EnableQueryResultDownload = "0"
, Implementation = "2.0"
]
)
, ref_database =
Source{[
Name = Catalog
, Kind = "Database"
]}[Data]
, ref_schema =
ref_database{[
Name = Schema
, Kind = "Schema"
]}[Data]
in
ref_schema
```
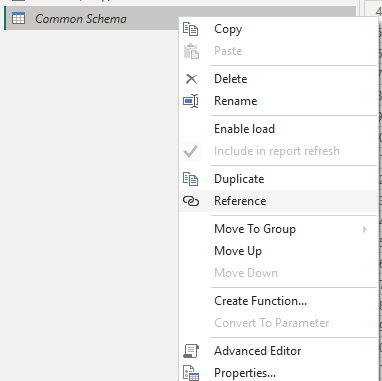
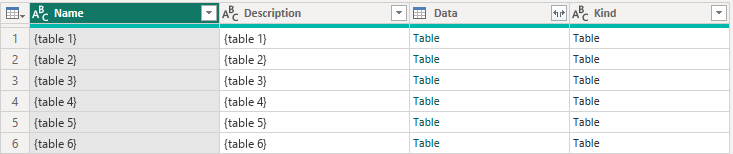
 For each table or view you want in your model, right-click **Common Schema** and select **Reference**. In the new query, select the **Table** link in the Data column for the table or view you want.
 Make any adjustments each table needs, for example setting data types.
## Option 3: Run a Databricks Query
This option uses a shared function called **Common Query Function**. You paste a SQL query into it and it returns the result as a table.
Create the four connection parameters described in [Set up your connection](#set-up-your-connection), if you have not already.
Create a blank query, open the **Advanced Editor**, paste in the code below, and name the query `Common Query Function`.
```powerquery theme={null}
let
Source = Databricks.Query(
DatabricksHost
, DatabricksHTTPPath
, [
EnableQueryResultDownload = "0"
, Implementation = "2.0"
]
)
in
Source
```
Make any adjustments each table needs, for example setting data types.
## Option 3: Run a Databricks Query
This option uses a shared function called **Common Query Function**. You paste a SQL query into it and it returns the result as a table.
Create the four connection parameters described in [Set up your connection](#set-up-your-connection), if you have not already.
Create a blank query, open the **Advanced Editor**, paste in the code below, and name the query `Common Query Function`.
```powerquery theme={null}
let
Source = Databricks.Query(
DatabricksHost
, DatabricksHTTPPath
, [
EnableQueryResultDownload = "0"
, Implementation = "2.0"
]
)
in
Source
```
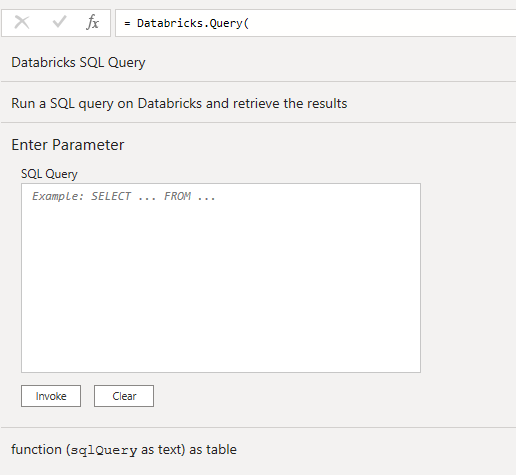 Paste the query you want to run into the **SQL Query** box of the function and select **Invoke**. If the query runs, the results appear.
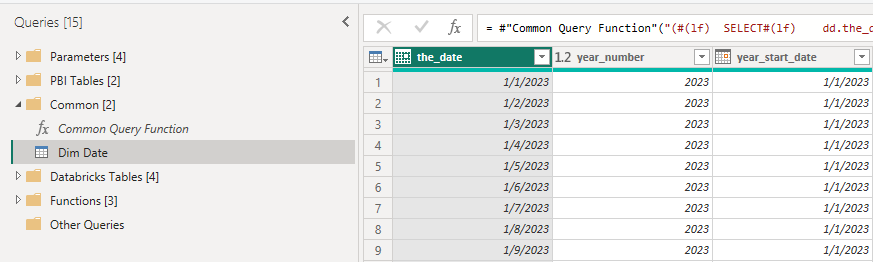 Repeat for each result set you want in your model. You can then load them as if they were views in Databricks.
Always use fully qualified names in your queries: `catalog.schema.table`.
## Set Up Your Connection
### Connection Details
Ask your Entegrata Customer Experience Manager for these four values.
| Parameter | What it is | Example |
| - | - | - |
| `DatabricksHost` | The URL of your Databricks instance. | `adb-{workspace-id}.{number}.azuredatabricks.net` |
| `DatabricksHTTPPath` | The part of the URL that points to your SQL warehouse. | `/sql/1.0/warehouses/{warehouse}` |
| `Catalog` | The Unity Catalog that holds your schemas. | `{yourfirm}_gold` |
| `Schema` | The schema inside the catalog that holds your tables and views. | `main` |
### Parameters
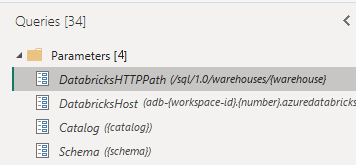
Create one Power BI parameter for each value, using the names in the table above. The code in options 2 and 3 uses those names. See [Microsoft Learn: Using parameters](https://learn.microsoft.com/power-query/power-query-query-parameters).
Repeat for each result set you want in your model. You can then load them as if they were views in Databricks.
Always use fully qualified names in your queries: `catalog.schema.table`.
## Set Up Your Connection
### Connection Details
Ask your Entegrata Customer Experience Manager for these four values.
| Parameter | What it is | Example |
| - | - | - |
| `DatabricksHost` | The URL of your Databricks instance. | `adb-{workspace-id}.{number}.azuredatabricks.net` |
| `DatabricksHTTPPath` | The part of the URL that points to your SQL warehouse. | `/sql/1.0/warehouses/{warehouse}` |
| `Catalog` | The Unity Catalog that holds your schemas. | `{yourfirm}_gold` |
| `Schema` | The schema inside the catalog that holds your tables and views. | `main` |
### Parameters
Create one Power BI parameter for each value, using the names in the table above. The code in options 2 and 3 uses those names. See [Microsoft Learn: Using parameters](https://learn.microsoft.com/power-query/power-query-query-parameters).
 ### Required Connection Options
The code above already sets both of these. Keep them if you write your own queries. Both are described in [Microsoft Learn: Azure Databricks connector](https://learn.microsoft.com/power-query/connectors/databricks-azure).
* `EnableQueryResultDownload = "0"` handles firewall restrictions.
* `Implementation = "2.0"` uses the newer ADBC driver instead of the ODBC driver, which is being retired.
The ADBC driver is in preview. Databricks lists ADBC support for Power BI as a public preview, although Power BI uses it by default for new Databricks connections. See [Microsoft Learn: Transition from ODBC to ADBC drivers](https://learn.microsoft.com/power-query/transition-to-adbc).
## Sign In
Power BI or Power BI Desktop may ask you to sign in, and you may need to complete two-factor authentication. Use your EntegrataOne account if you have been issued one. Otherwise, use your organization's credentials.
## Learn More
* [Microsoft Learn: Power BI report creation](https://learn.microsoft.com/power-bi/create-reports/)
* [Tour the report editor](https://learn.microsoft.com/power-bi/create-reports/service-the-report-editor-take-a-tour)
* [Report view in Power BI Desktop](https://learn.microsoft.com/power-bi/create-reports/desktop-report-view)
* [Interact with a report in Editing view](https://learn.microsoft.com/power-bi/create-reports/service-interact-with-a-report-in-editing-view)
* [Add a filter to a report](https://learn.microsoft.com/power-bi/create-reports/power-bi-report-add-filter)
* [Create Apply All and Clear All slicer buttons](https://learn.microsoft.com/power-bi/create-reports/buttons-apply-all-clear-all-slicers)
* [Drillthrough in Power BI reports](https://learn.microsoft.com/power-bi/create-reports/desktop-drillthrough)
* [Add visualizations to a report](https://learn.microsoft.com/power-bi/visuals/power-bi-report-add-visualizations)
## Related topics
- [Power BI Overview](/power-bi/overview.md)
- [Recommended Tenant Settings](/power-bi/tenant-settings.md)
This documentation is built and hosted on [Mintlify](https://mintlify.com), a developer documentation platform.
### Required Connection Options
The code above already sets both of these. Keep them if you write your own queries. Both are described in [Microsoft Learn: Azure Databricks connector](https://learn.microsoft.com/power-query/connectors/databricks-azure).
* `EnableQueryResultDownload = "0"` handles firewall restrictions.
* `Implementation = "2.0"` uses the newer ADBC driver instead of the ODBC driver, which is being retired.
The ADBC driver is in preview. Databricks lists ADBC support for Power BI as a public preview, although Power BI uses it by default for new Databricks connections. See [Microsoft Learn: Transition from ODBC to ADBC drivers](https://learn.microsoft.com/power-query/transition-to-adbc).
## Sign In
Power BI or Power BI Desktop may ask you to sign in, and you may need to complete two-factor authentication. Use your EntegrataOne account if you have been issued one. Otherwise, use your organization's credentials.
## Learn More
* [Microsoft Learn: Power BI report creation](https://learn.microsoft.com/power-bi/create-reports/)
* [Tour the report editor](https://learn.microsoft.com/power-bi/create-reports/service-the-report-editor-take-a-tour)
* [Report view in Power BI Desktop](https://learn.microsoft.com/power-bi/create-reports/desktop-report-view)
* [Interact with a report in Editing view](https://learn.microsoft.com/power-bi/create-reports/service-interact-with-a-report-in-editing-view)
* [Add a filter to a report](https://learn.microsoft.com/power-bi/create-reports/power-bi-report-add-filter)
* [Create Apply All and Clear All slicer buttons](https://learn.microsoft.com/power-bi/create-reports/buttons-apply-all-clear-all-slicers)
* [Drillthrough in Power BI reports](https://learn.microsoft.com/power-bi/create-reports/desktop-drillthrough)
* [Add visualizations to a report](https://learn.microsoft.com/power-bi/visuals/power-bi-report-add-visualizations)
## Related topics
- [Power BI Overview](/power-bi/overview.md)
- [Recommended Tenant Settings](/power-bi/tenant-settings.md)
This documentation is built and hosted on [Mintlify](https://mintlify.com), a developer documentation platform.